Developing a bibliometric analysis can seem like a daunting task for those who are just starting out in scientific research.
It is common to feel insecure: is the methodology structured enough? Was the search properly conducted? Is the database appropriate? Do the maps really show something relevant? Are the results strong enough to be included in an article, dissertation, or thesis?
Before anything else, it is worth saying: this is normal.
Bibliometric analysis is a technical process, but it is also a learning process. The first attempts will rarely be perfect; in fact, perfection cannot even be achieved — and that is okay. With practice, you begin to better understand how to formulate searches, process databases, interpret maps, and transform bibliometric data into scientific arguments.
In this text, I will show you one possible path for conducting a bibliometric analysis from scratch: from the initial definition of the topic to data export, database processing, and the use of tools such as VOSviewer, Bibliometrix, and resources from Xplore Academy.
An important note before moving forward: there is no single way to conduct a bibliometric analysis. There are more or less appropriate paths depending on the research objective, the field of knowledge, the databases used, and the type of question you intend to answer.
1. Start by understanding what you want to research
The first step is not opening a database.
The first step is understanding what you want to investigate.
It may seem simple, but many researchers begin bibliometrics by “shooting in the dark.” They open Scopus, Web of Science, or another database, type a few loose words, and expect the search results to solve the problem.
In practice, it does not work that way.
Before searching for articles, pause and reflect:
- What topic do you want to study?
- Where did this need come from?
- Was it a course that required a scientific paper?
- Was it curiosity generated by a previous reading?
- Was it a gap identified in a research area?
- Was it a demand from your research group, advisor, or project?
These questions help transform a broad idea into a clearer scope.
For example, “artificial intelligence in education” is a very broad topic. On the other hand, “the use of generative artificial intelligence in academic writing among graduate students” is a more focused scope.
The clearer your initial focus is, the easier it will be to create a consistent search strategy.
2. Conduct exploratory readings before building the search
After defining the initial topic, begin conducting exploratory readings.
Reading is a fundamental step because it helps you identify recurring terms, important authors, relevant journals, methodological approaches, and possible gaps.
Here, I need to be honest with you: you cannot read everything.
Today, there is an enormous number of articles published in practically every field. For this reason, the goal of exploratory reading is not to exhaust the topic right away, but to understand the vocabulary of the field and notice how researchers are addressing a given subject.
During this reading, take notes on:
- frequent keywords;
- terms in English and Portuguese;
- synonyms used by authors;
- related concepts;
- recurring authors;
- journals that appear frequently;
- methods used in the studies;
- possible gaps mentioned in the articles.
These notes will be useful when building your search query.
3. Use a research notebook to organize your ideas
As you read, take notes.
This can be done in a physical notebook, a document on your computer, a spreadsheet, Notion, Obsidian, Zotero, or any other environment that works for you.
The important thing is not to rely only on memory.
A good note can record:
- the article read;
- the objective of the study;
- the main concepts;
- the keywords used;
- the methodology;
- the main results;
- the limitations pointed out by the authors;
- ideas that may help your own research.
Over time, these notes help you notice patterns. You begin to observe that certain terms appear together, that some authors are in dialogue with each other, that certain methods are more common, and that some gaps are repeated.
This is exactly where a bibliometric analysis begins to make sense.
It helps synthesize a larger set of publications and offers a structured view of the scientific production in a field.
And remember: it is a note, not a summary. AI can make summaries. The idea is that you write what you actually understood and what you found interesting in that research.
4. Understand the role of bibliometric analysis
Bibliometric analysis is a methodology used to examine patterns in scientific production.
It can help identify, for example:
- the evolution of publications over time;
- the most productive authors;
- the most cited articles;
- the most relevant journals;
- the most present institutions and countries;
- co-authorship networks;
- keyword co-occurrence;
- thematic clusters;
- research trends;
- possible gaps.
But be careful: bibliometrics is not just about generating beautiful charts.
Notice the detail: the map does not interpret the research by itself. It shows relationships, proximities, and patterns within the analyzed database. Interpretation depends on the researcher.
A keyword cluster, for example, may suggest a thematic line. But you need to read the articles, understand the context, and evaluate whether that interpretation makes sense.
Bibliometrics organizes evidence. It does not replace critical reading.
5. Choose the databases
After the initial readings, you need to decide where you will search for the articles.
The most commonly used databases in bibliometric analyses are usually Scopus and Web of Science, because they have broad coverage, good metadata, and integration with bibliometric tools. However, this does not mean they are the only options.
Depending on the field and the research objective, you may also consider databases such as SciELO, SPELL, PubMed, Dimensions, Lens, among others.
The most important thing is to justify the choice.
You can explain, for example, that you used a given database because it has broad international coverage, because it is recognized in your field, or because it gathers journals relevant to the topic studied.
It is also possible to use more than one database, but this requires extra care when processing the data, especially to remove duplicate records. The database merging tool from Xplore Academy can help you with this. I will explain it in more detail shortly.
6. Build your search strategy with keywords
Now comes one of the most important steps: building the query.
The query is the search expression you run within a database. It combines keywords, expressions, and operators to retrieve documents related to your topic.
To build a good query, return to your exploratory readings and observe the most frequently used terms.
Imagine that you want to study generative artificial intelligence in scientific writing. You could start by listing terms such as:
generative artificial intelligencegenerative AIChatGPTacademic writingscientific writingresearch writinghigher education
But simply listing words is not enough. You need to connect these terms logically. This is where Boolean operators come in.
7. What are Boolean operators and how should you use them?
Boolean operators are commands used to combine, broaden, or restrict search results in databases.
The most common ones are: AND, OR, and NOT.
It is also common to use quotation marks, parentheses, and truncation symbols to make the search more precise.
AND
The AND operator is used to combine different terms.
It restricts the search because it retrieves documents that contain both terms.
Example:
"generative AI" AND "academic writing"
This search tends to retrieve documents that address both subjects at the same time: generative artificial intelligence and academic writing.
OR
The OR operator is used to include synonyms or related terms.
It broadens the search because it retrieves documents that contain any of the indicated terms.
Example:
"generative AI" OR "generative artificial intelligence" OR ChatGPT
This search considers different ways of naming the same phenomenon or closely related phenomena.
NOT
The NOT operator is used to exclude terms that are not relevant to the research.
It should be used with caution, because it may remove relevant documents without you noticing.
Example:
"artificial intelligence" NOT "machine learning"
This command excludes documents that mention machine learning. In some contexts this may make sense, but in others it may harm the search.
Quotation marks
Quotation marks are used to search for an exact expression.
Example:
"academic writing"
Without quotation marks, the database may search for the words separately. With quotation marks, it searches for the complete expression.
Parentheses
Parentheses help organize more complex searches.
Example:
("generative AI" OR "generative artificial intelligence" OR ChatGPT) AND ("academic writing" OR "scientific writing" OR "research writing")
In this case, the search retrieves documents that mention some term related to generative artificial intelligence and some term related to academic or scientific writing.
Asterisk or truncation
Some databases allow you to use an asterisk to search for variations of a word.
Example:
educat*
This term may retrieve variations such as education, educational, and educator, depending on the database.
Before using it, check the rules of the chosen database, because each platform may have small differences in syntax.
8. Test and refine the query
A good query rarely comes ready-made.
You will probably need to test, adjust, and test again.
If you get too few results, the search may be too restrictive. In that case, you can include synonyms, remove a very specific term, or use OR to broaden the coverage.
If you get too many results and many of them are unrelated to the topic, the search may be too broad. In that case, you can add terms with AND, search in the title, abstract, and keywords, or delimit areas, languages, years, and document types.
It is worth pausing here: the goal is not simply to obtain the largest possible number of articles. A large database may look impressive, but it does not necessarily generate a good analysis.
The ideal is to build a database that is coherent, traceable, and aligned with the research question.
9. Export the data from the databases
After defining the query and applying the necessary filters, you need to export the records.
In Scopus, Web of Science, and other databases, it is generally possible to export metadata such as:
- title;
- authors;
- abstract;
- keywords;
- year of publication;
- journal;
- DOI;
- references;
- citations;
- affiliations;
- country;
- document type.
Whenever possible, export the complete data, as this increases the possibilities for later analysis.
Depending on the database, you may export in formats such as .bib, .ris, .csv, .txt, or others.
If you are not yet familiar with these databases, it is worth first studying how each one works, which fields it allows you to export, and which filters can be applied.
10. Process the database and remove duplicates
If you exported data from more than one database, you will probably have duplicate records.
This happens when the same article is present, for example, in both Scopus and Web of Science.
Therefore, before generating maps and charts, you need to process the data.
The processing may involve:
- removing duplicate records;
- standardizing fields;
- checking DOIs;
- checking similar titles;
- organizing file formats;
- preparing the database for bibliometric software.
This step is important because a database with duplicates can distort the results. A duplicated article may appear twice, influence counts, and harm the interpretation of the data.
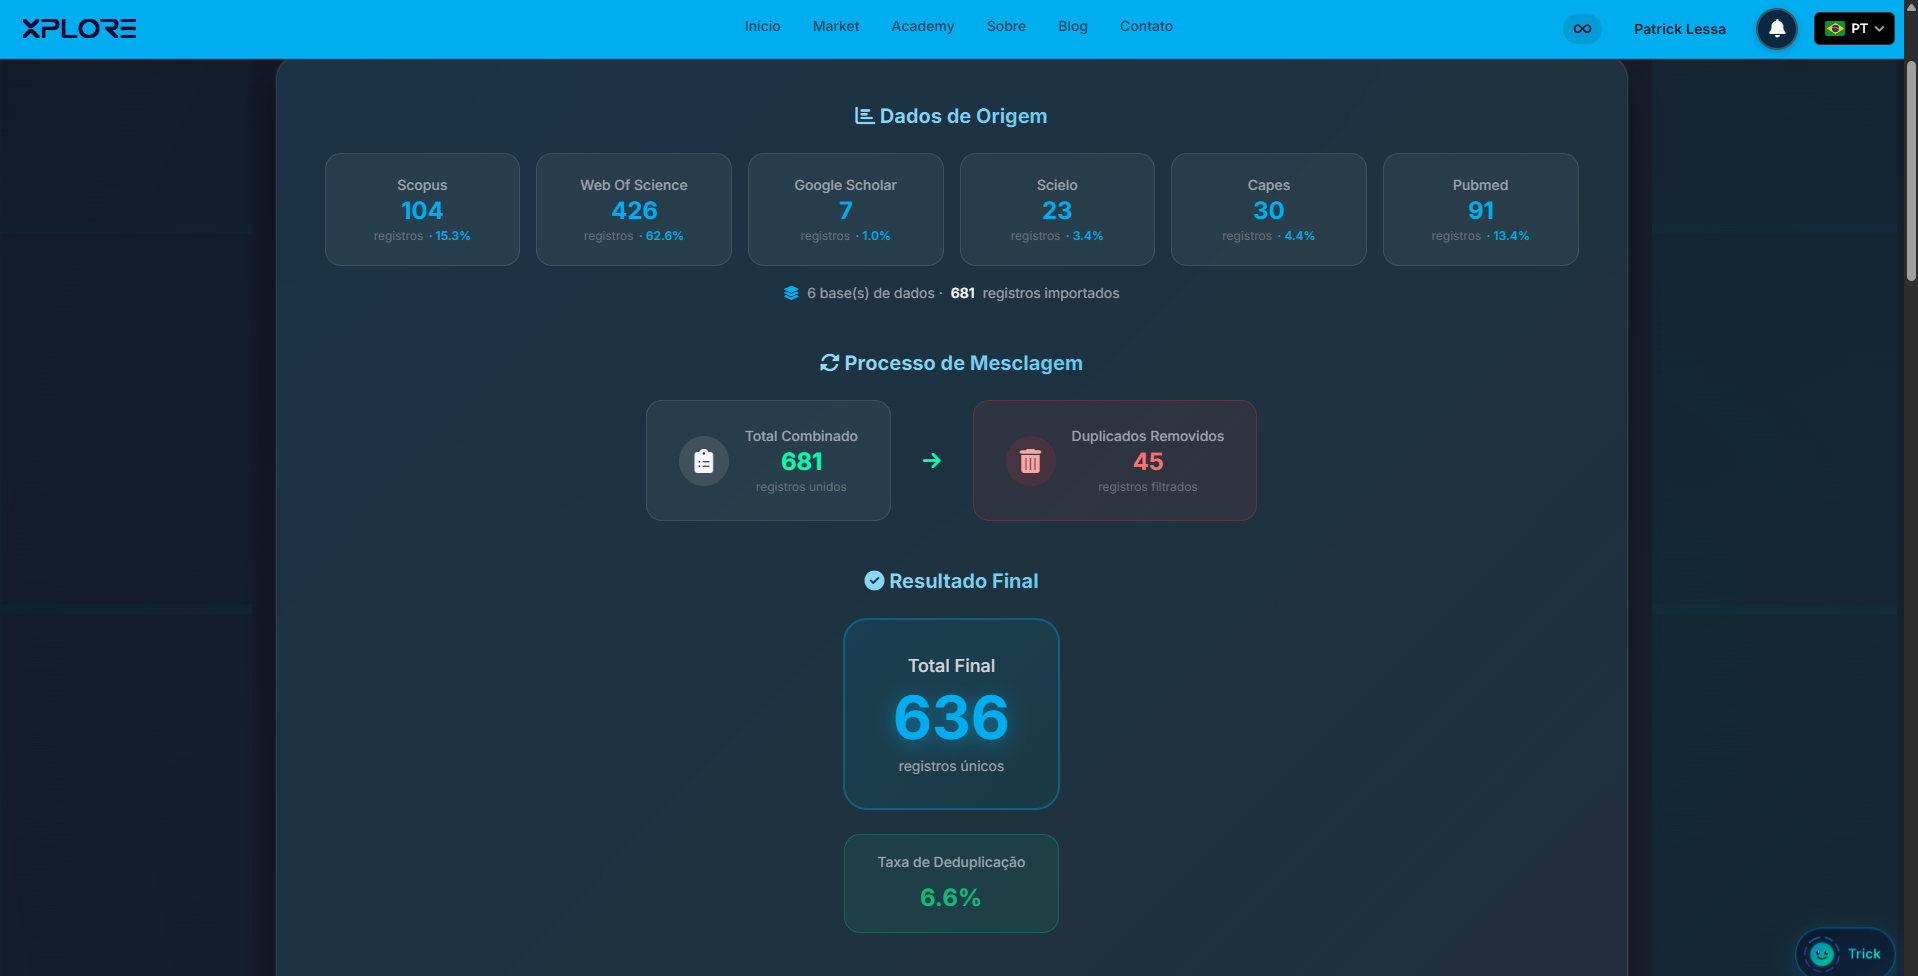
Xplore Academy has a tool that helps with this merging and processing process. The idea is to allow the researcher to upload the files exported from the databases and obtain a consolidated database, with identification of repeated records.
The tool considers information such as DOI and title to support duplicate detection. After merging, the user can download different files to continue the analysis.
11. How to use Xplore’s Merge Databases tool
To use the tool, the first step is to create an account on Xplore: Xplore Dados - Registration
Then, access Xplore Academy and select the Merge Databases tool.
In this tool, you will be able to upload the files exported from the databases used, such as Scopus, Web of Science, or others, as long as they are in compatible formats, such as .bib, .nbib, .ris, .csv, or .txt.
After the upload, the platform presents a processing summary, including:
- number of records in each file;
- number of records analyzed;
- duplicates identified;
- final total of the processed database.
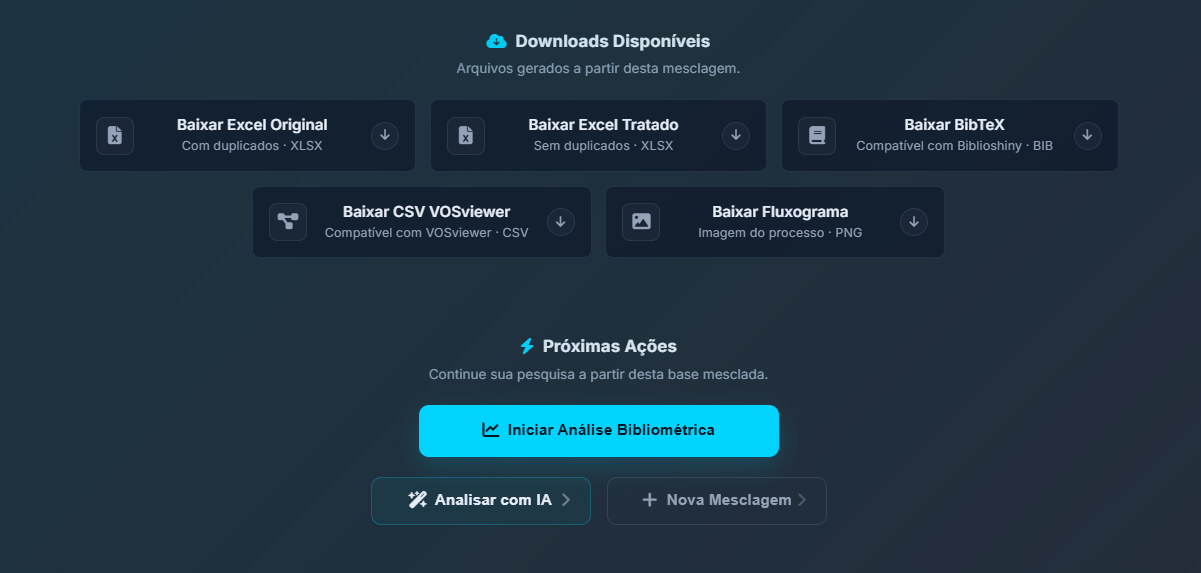
After that, you will be able to download files in different formats, such as:
- original Excel file, with all records;
- processed Excel file, without duplicate records;
- BibTeX file;
- file compatible with VOSviewer;
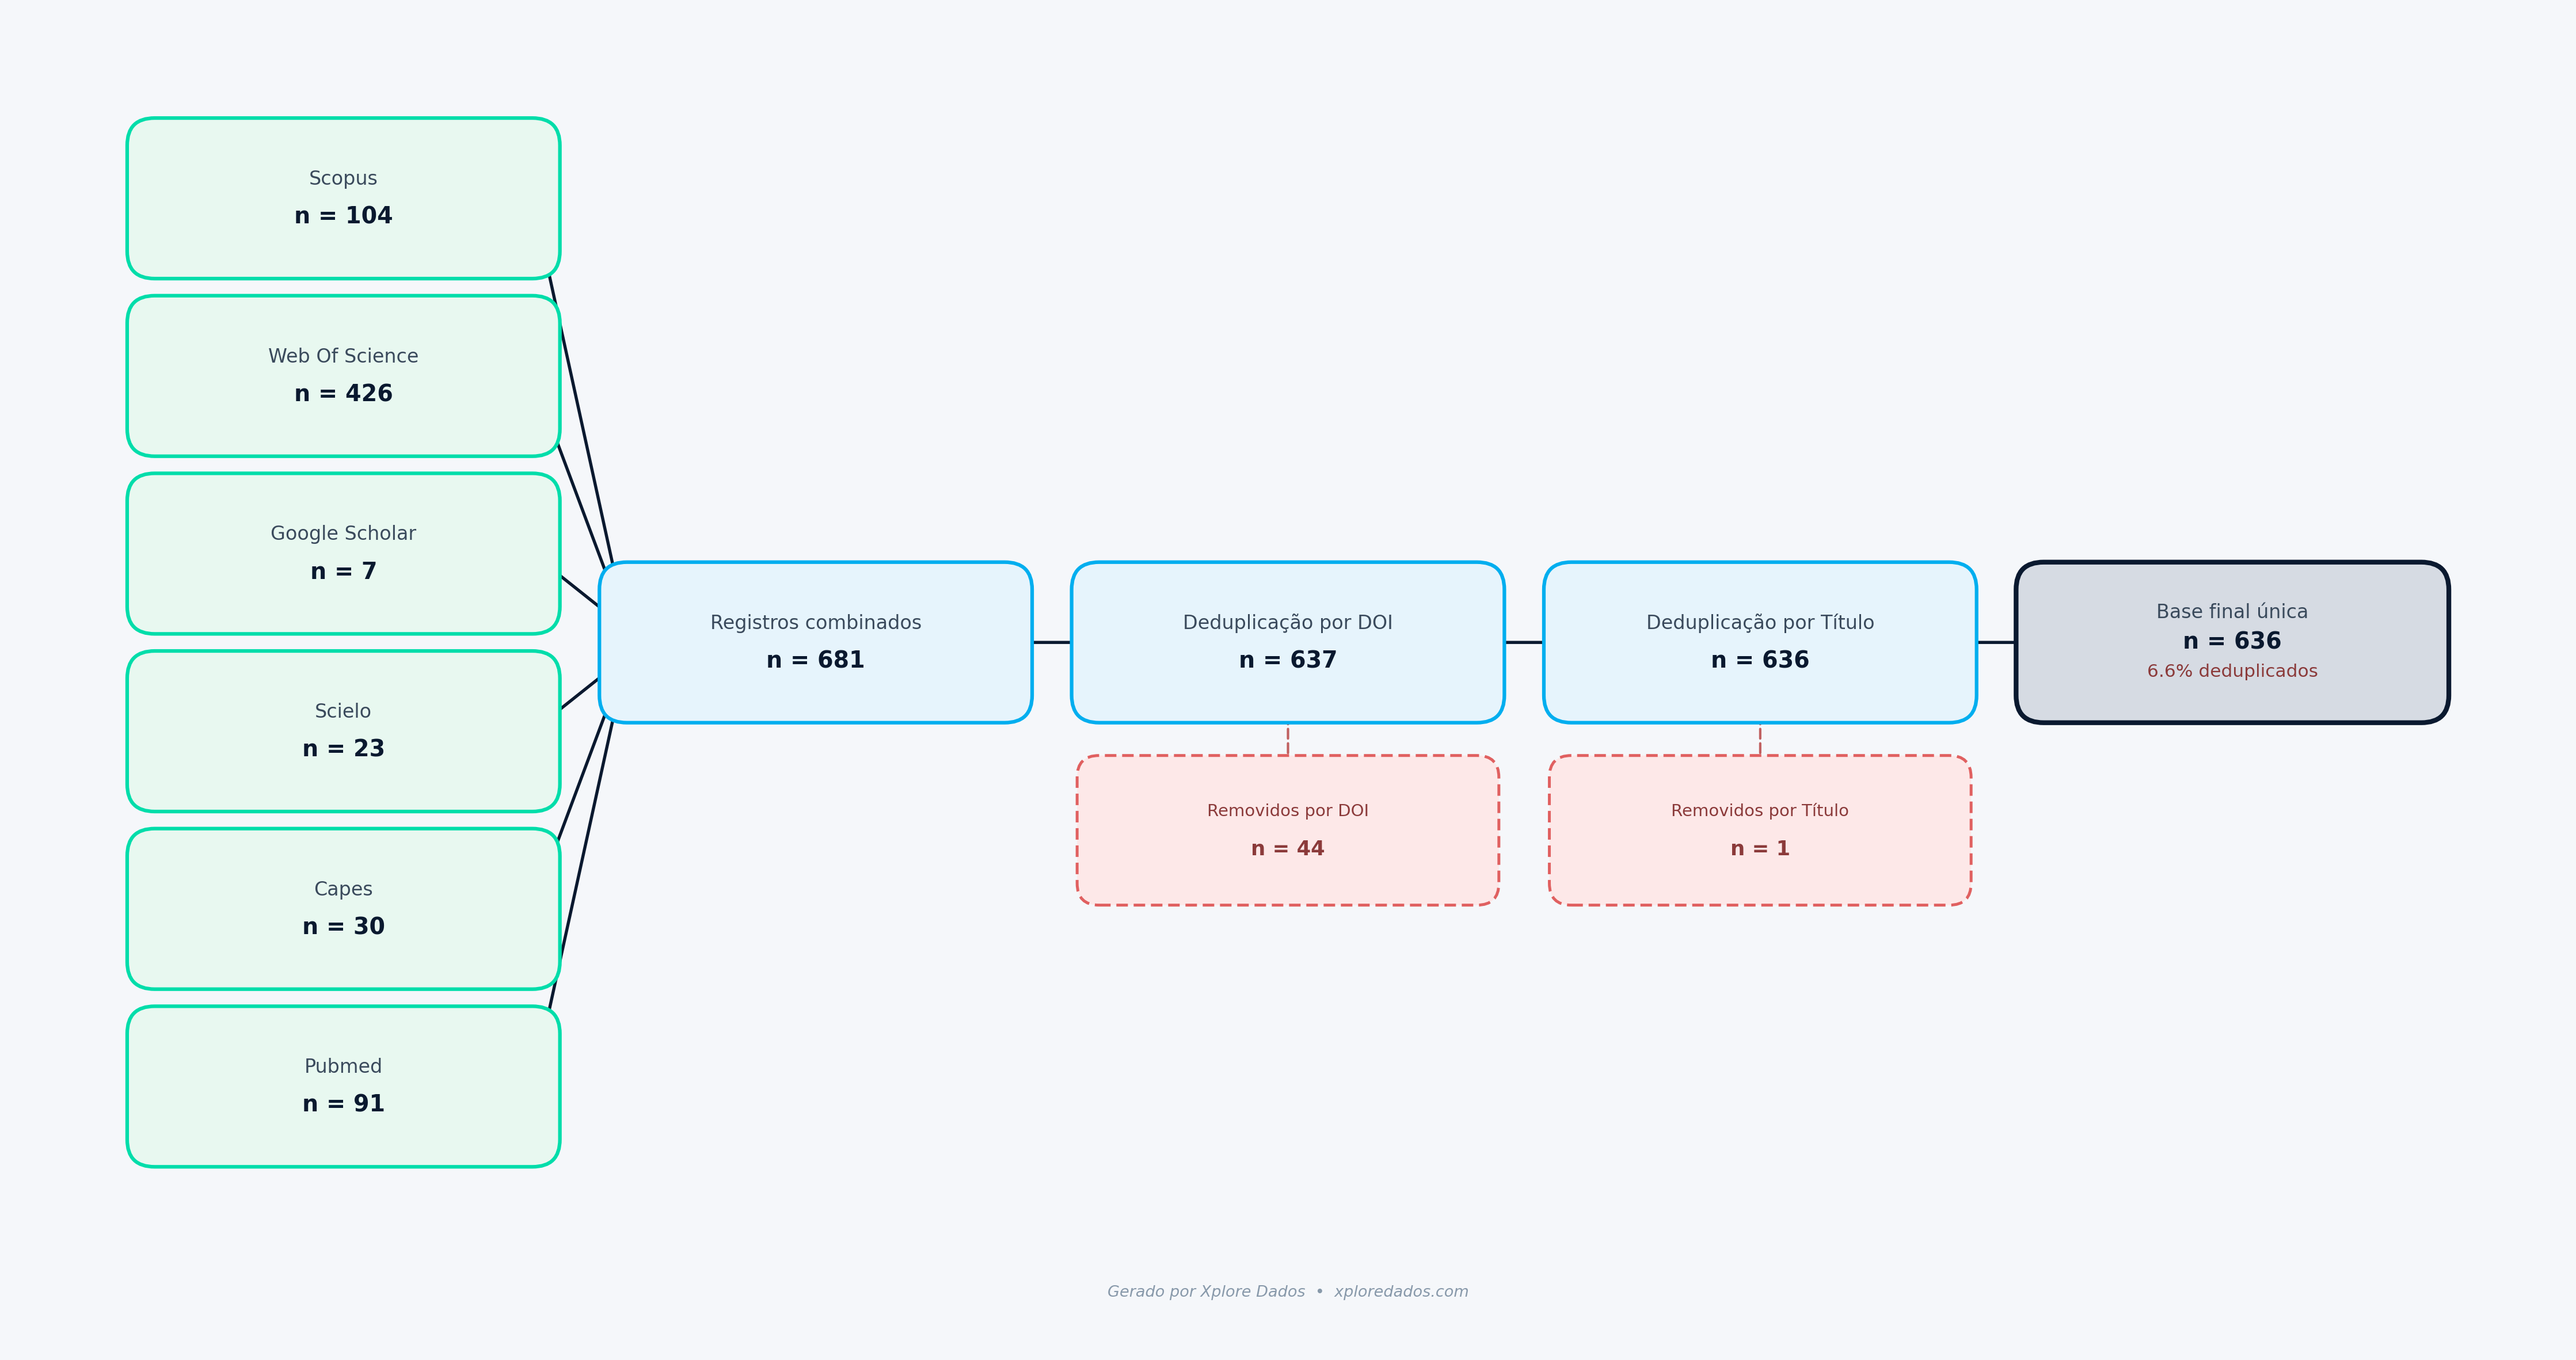
- flowchart of the merging process.
The flowchart is especially useful for documenting the methodology, because it visually shows how the records were gathered, processed, and filtered.
12. Generate maps in VOSviewer
After processing the database, you can use VOSviewer to create bibliometric maps.
VOSviewer is widely used to generate networks of keyword co-occurrence, co-authorship, co-citation, bibliographic coupling, and other relationships.
A common path inside VOSviewer is:
Create > Create a map based on bibliographic data > Read data from bibliographic database files > select the database > configure the type of analysis > generate the map
In other words, the file downloaded from the Merge Databases tool is aligned with the file format that VOSviewer reads as Scopus.
From there, the software allows you to configure criteria such as the minimum number of occurrences, type of network, normalization, and visualization.
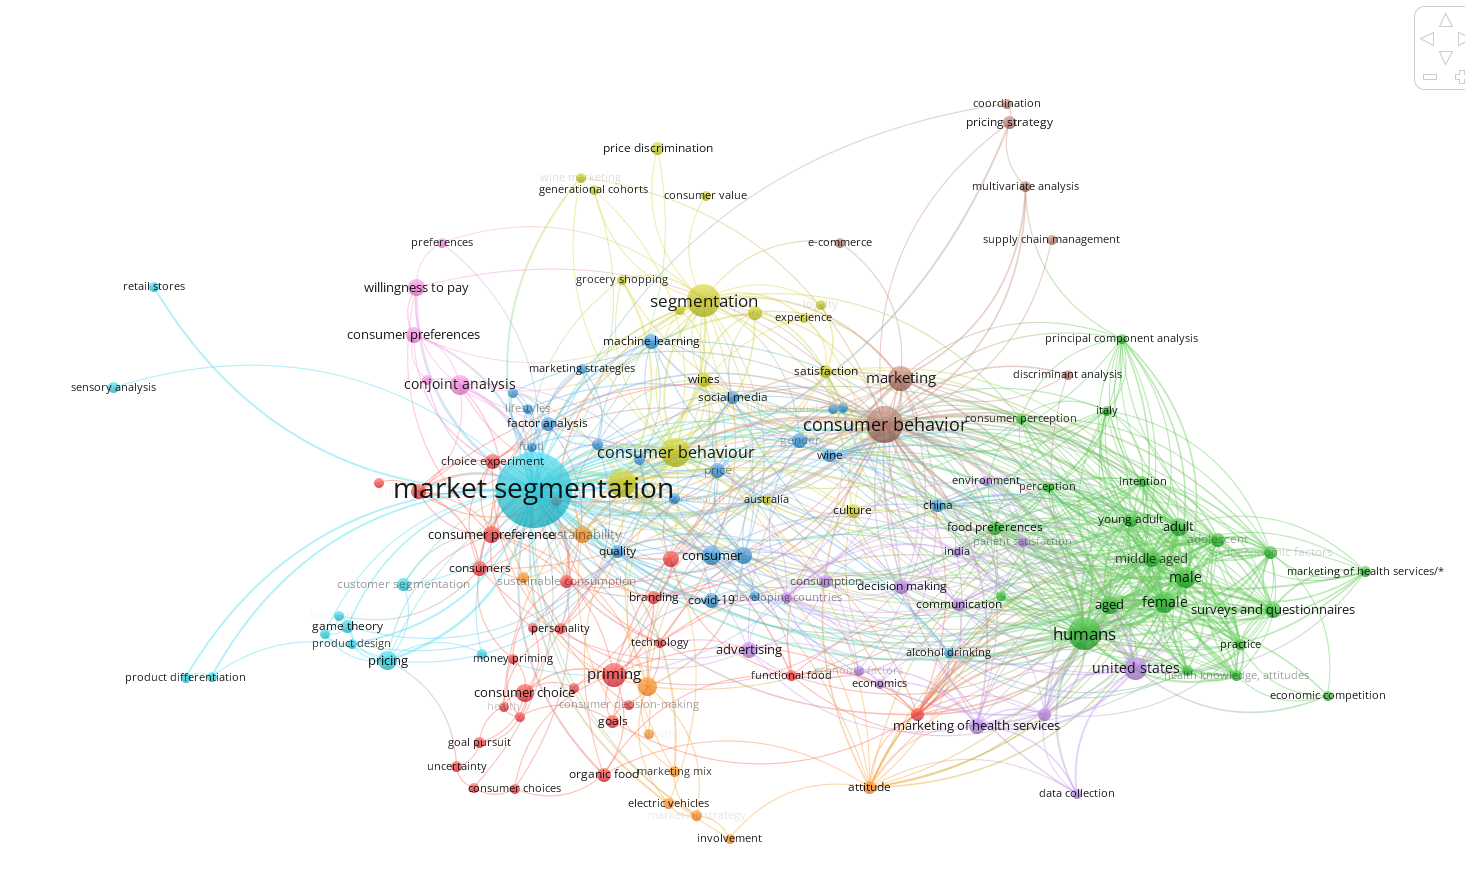
But be careful: VOSviewer generates the map, not the conclusion.
A cluster may indicate thematic proximity, but the interpretation needs to consider the content of the articles. Words that are close on the map do not automatically mean that the studies say the same thing. They indicate association within the analyzed database.
13. Use Bibliometrix for complementary analyses
Another tool widely used in bibliometrics is Bibliometrix, an R package with the Biblioshiny interface.
It allows you to generate descriptive analyses and charts about the database, such as:
- main information about the collection;
- annual scientific production;
- most productive authors;
- most relevant sources;
- most cited documents;
- countries and institutions;
- keywords;
- thematic networks;
- collaboration maps.
One possible path in the interface is:
Import or Load > Database > choose the database > configure the author name format > select the file > Start
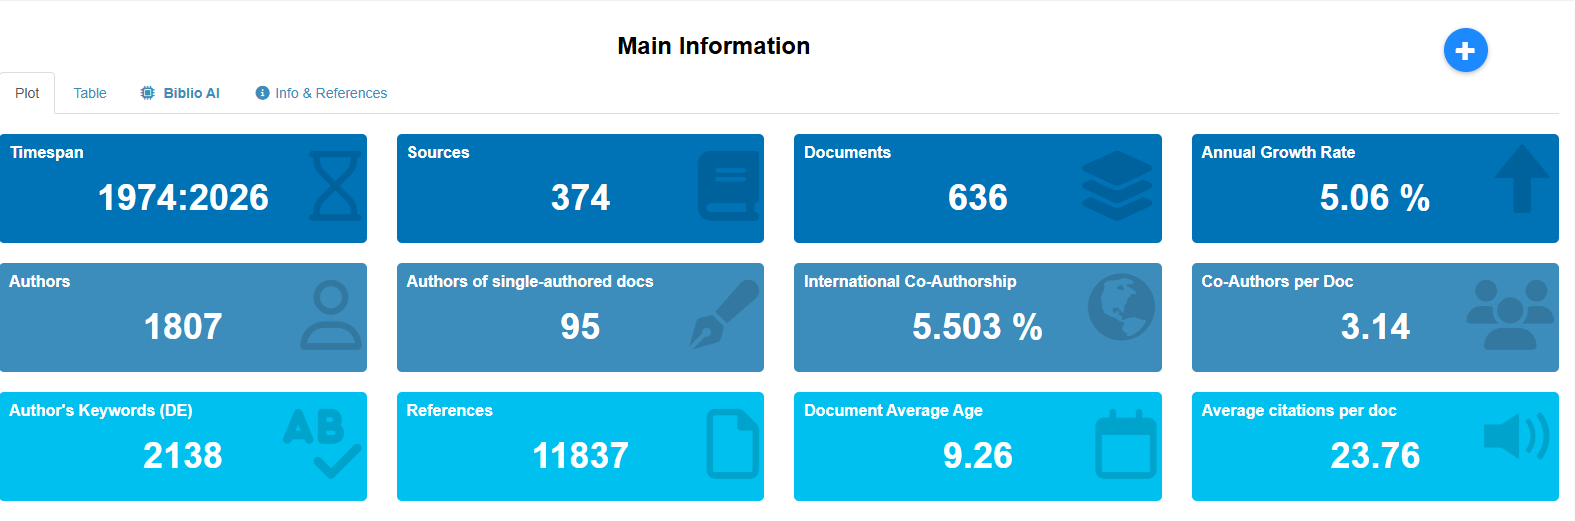
This information helps build the descriptive part of the bibliometric analysis.
For example, by observing the number of documents, the period analyzed, annual growth, and average citations, you begin to understand the general behavior of the literature on the topic.
14. Use Xplore’s bibliometric analysis as support
In addition to VOSviewer and Bibliometrix, Xplore Academy also offers resources to start a bibliometric analysis directly from the processed database.
After merging the files, you can use the option to start the bibliometric analysis. The tool generates charts and visualizations that help observe patterns in the database.
Among the available resources, it is possible to view charts such as publications by year, authors’ production over time, and keyword networks.
In some charts, there is also an option to generate an initial description of the result.
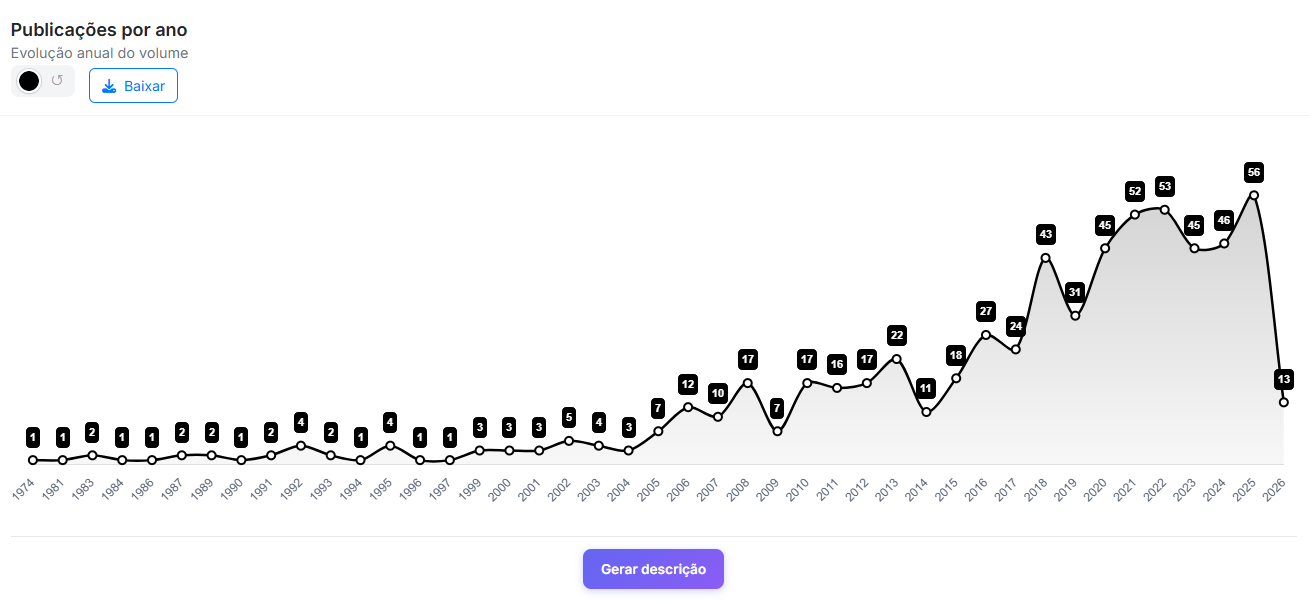
This resource can be very helpful in the first reading of the data. However, the generated description should be seen as support, not as a final conclusion.
Before using any interpretation in a scientific article, review the data, check whether the database is correct, and evaluate whether the description makes sense in relation to the topic and the research question.
Tools help reduce manual work, but critical judgment remains the researcher’s responsibility.
15. How to interpret the publications-by-year chart
One of the most common charts in a bibliometric analysis is the publications-by-year chart.
It shows how scientific production on a given topic has evolved over time.
When analyzing this chart, observe:
- in which year the first publications began;
- whether there was gradual growth;
- whether there is a period of acceleration;
- whether there are drops or fluctuations;
- whether the most recent years are still incomplete;
- whether any external event may have influenced the increase in publications.
For example, a drop in the last year of the database may not mean a loss of interest in the topic. It often occurs because the year has not ended yet or because the databases have not yet indexed all documents.
Notice the detail: interpreting bibliometrics requires caution regarding database indexing time.
A chart may show a significant increase in publications, but this must be discussed carefully. Growth in the volume of articles indicates greater scientific attention, but it does not necessarily mean theoretical maturity, methodological consensus, or superior study quality.
16. How to interpret authors’ production over time
Another useful chart is authors’ production over time.
It allows you to observe which researchers have published on the topic, in which periods, and with what intensity.
This type of visualization can help identify:
- pioneering authors;
- authors with recent production;
- researchers with publications concentrated in a specific period;
- continuity or interruption of production;
- possible academic leaders in the topic.
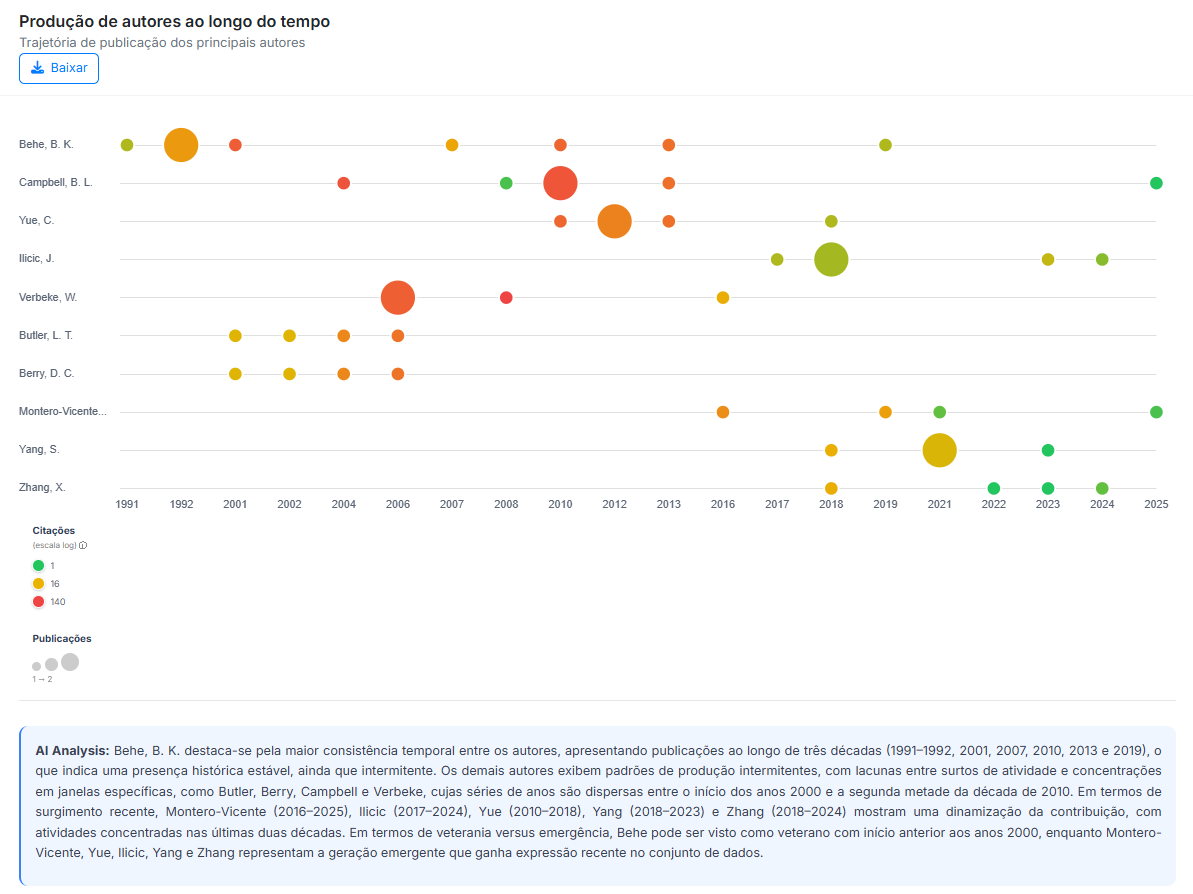
But again: productivity should not automatically be confused with relevance.
An author may have many articles and little theoretical influence. Another may have few articles but a major impact on the formation of the field.
Therefore, combine the visual analysis with the reading of the most important documents.
17. How to interpret keyword networks
Keyword networks are very useful for identifying themes and subthemes within a field.
In this type of map, each node represents a keyword. The size of the node usually indicates the frequency of the term. The lines indicate co-occurrence relationships. The colors generally represent clusters, that is, groups of words that appear associated more frequently.
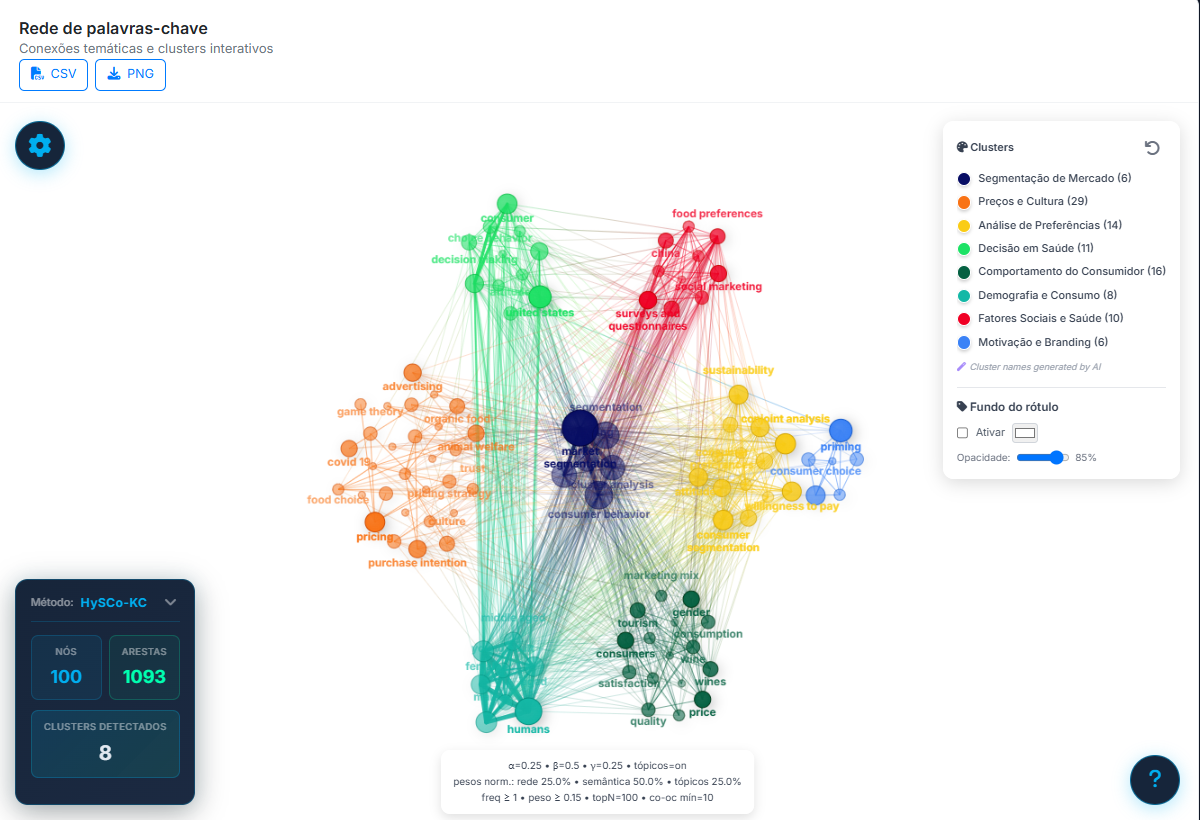
When interpreting this map, ask:
- which terms appear at the center of the network?
- which clusters were formed?
- what theme does each cluster seem to represent?
- are there emerging words?
- are there poorly connected themes?
- are there terms that are too generic and could have been treated?
- do the clusters make sense after reading the articles?
A good interpretation should not merely describe the colors of the map.
It is not enough to write: “the red cluster deals with marketing, the blue one with technology, and the green one with consumption.”
The ideal approach is to explain what these groupings indicate about the development of the literature, which debates seem more consolidated, and which themes may represent research opportunities.
18. What should be included in the results of a bibliometric analysis?
The results section of a bibliometric analysis can vary considerably, but it usually includes a combination of descriptive analysis and network analysis.
You can present:
- general characteristics of the database;
- evolution of publications;
- main journals;
- most productive authors;
- most cited documents;
- countries and institutions;
- collaboration between authors;
- keyword co-occurrence;
- thematic clusters;
- trends and gaps.
The choice depends on your research question.
Here is a simple question that can guide the entire process:
With the data I have today, what do I want to show the scientific community?
This question prevents you from including charts only because they look visually interesting.
Not every chart needs to be included in the article. Include only what helps answer the research objective.
19. Important methodological precautions
A bibliometric analysis needs to be transparent and traceable.
In the methodology section, try to report:
- databases used;
- date of data collection;
- complete query;
- filters applied;
- document types included;
- languages considered;
- period analyzed;
- inclusion and exclusion criteria;
- export format;
- duplicate removal procedure;
- software and tools used;
- criteria used to generate maps and networks.
This allows other researchers to understand how the database was built and which methodological decisions were made.
Before continuing, an important note: the quality of the analysis depends directly on the quality of the database.
If the search was poorly built, if the data was exported incompletely, or if duplicates were not treated, the results may be compromised.
20. Use reference managers from the beginning
In addition to bibliometric tools, I strongly recommend using reference managers such as Zotero and Mendeley.
These tools help organize articles, save metadata, insert citations into the text, and generate bibliographic references.
This is especially important because, during a review or bibliometric analysis, you may deal with dozens, hundreds, or even thousands of records.
With a reference manager, it becomes easier to control what has been read, what has been cited, and what still needs to be analyzed.
If you use Zotero, it is worth exploring features such as collections, tags, notes, plugins, and integration with text editors.
The goal is not just to store PDFs, but to build an organization system for your research.
21. Bibliometrics does not end when the map is generated
A common mistake is to think that the bibliometric analysis ends when the charts are ready.
In reality, this is only the beginning of the interpretation.
After generating the maps, you need to return to the literature, read the most relevant documents, compare patterns, understand the clusters, and transform the results into a coherent scientific narrative.
Bibliometrics helps answer questions such as:
- how has the field evolved?
- which themes have gained strength?
- which authors structure the discussion?
- which approaches appear most frequently?
- which connections still seem underexplored?
- where might research gaps exist?
But the answers do not come automatically.
They require critical analysis.
Conclusion
Conducting a bibliometric analysis from scratch involves more than downloading articles and generating maps.
The process begins with a good question, moves through exploratory readings, query construction, database selection, data export, database processing, duplicate removal, chart generation, and careful interpretation of the results.
Tools such as VOSviewer, Bibliometrix, and Xplore Academy can strongly support this path, especially in data organization, visualization creation, and generation of initial readings.
But no tool replaces the researcher’s critical perspective.
A well-conducted bibliometric analysis requires method, transparency, traceability, and interpretation. The map shows patterns. The person who transforms those patterns into scientific contribution is you.
If you want to better organize your database, remove duplicates, and start your analysis with greater clarity, discover Xplore Academy and test the resources designed for bibliometric analysis.
If you have any questions, contact us by email: contato@xploredados.com.